Better Insight to Make Better Decisions
Designed for Medical Administrators | Built on 20+ Years of Experience
Managing prior authorizations is challenging. But understanding their performance shouldn’t be. That’s why our Prior Authorization Reporting is designed with medical administrators in mind—giving you the insights you need without unnecessary complexity. Our reporting is built from 20+ years of experience, focusing on the metrics that truly impact your workflow, efficiency, and revenue cycle management.
 Overview
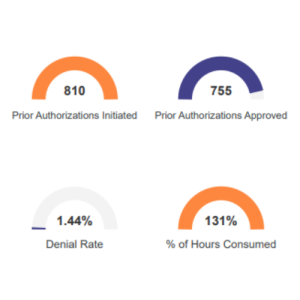
A high-level summary of prior authorization performance for the month, showing overall progress at a glance.
Why it matters: Quickly assess the effectiveness of your prior authorization process and identify any red flags.
Activity Breakdown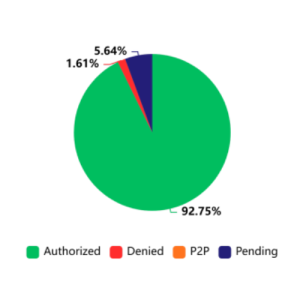
A look at all prior authorizations, categorized as:
✔ Initiated – The number of prior authorizations started.
✔ Approved – Successfully processed authorizations.
✔ Denied – Requests that were not approved.
✔ Pending – Authorizations are still in progress.
Why it matters: Track approval rates, spot trends in denials, and pinpoint delays in real time.
 Denial Rate Analysis
 Denial Rate Analysis
Your denial rate percentage gives insight into how many prior authorizations face obstacles.
Why it matters: High denial rates signal potential issues with documentation or payer policies—giving you a chance to adjust before they affect patient care and revenue.
Contracted Hours vs. Hours Worked
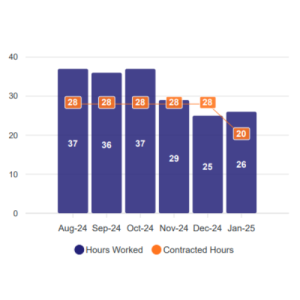
This section compares the contracted hours with actual hours worked to handle prior authorizations.
Why it matters: Optimize staffing and resource allocation to ensure your practice operates efficiently.
Case Activity: 6-Month Snapshot
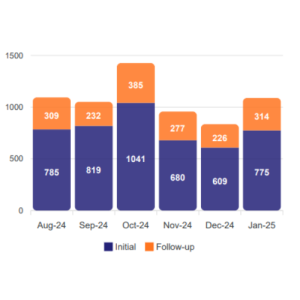 Case Activity: 6-Month Snapshot
A visual breakdown of prior authorization trends over the last six months.
- How many prior authorizations were initiated?
- How many required follow-ups?
Why it matters: Recognize seasonal trends, forecast workload, and allocate resources proactively.